

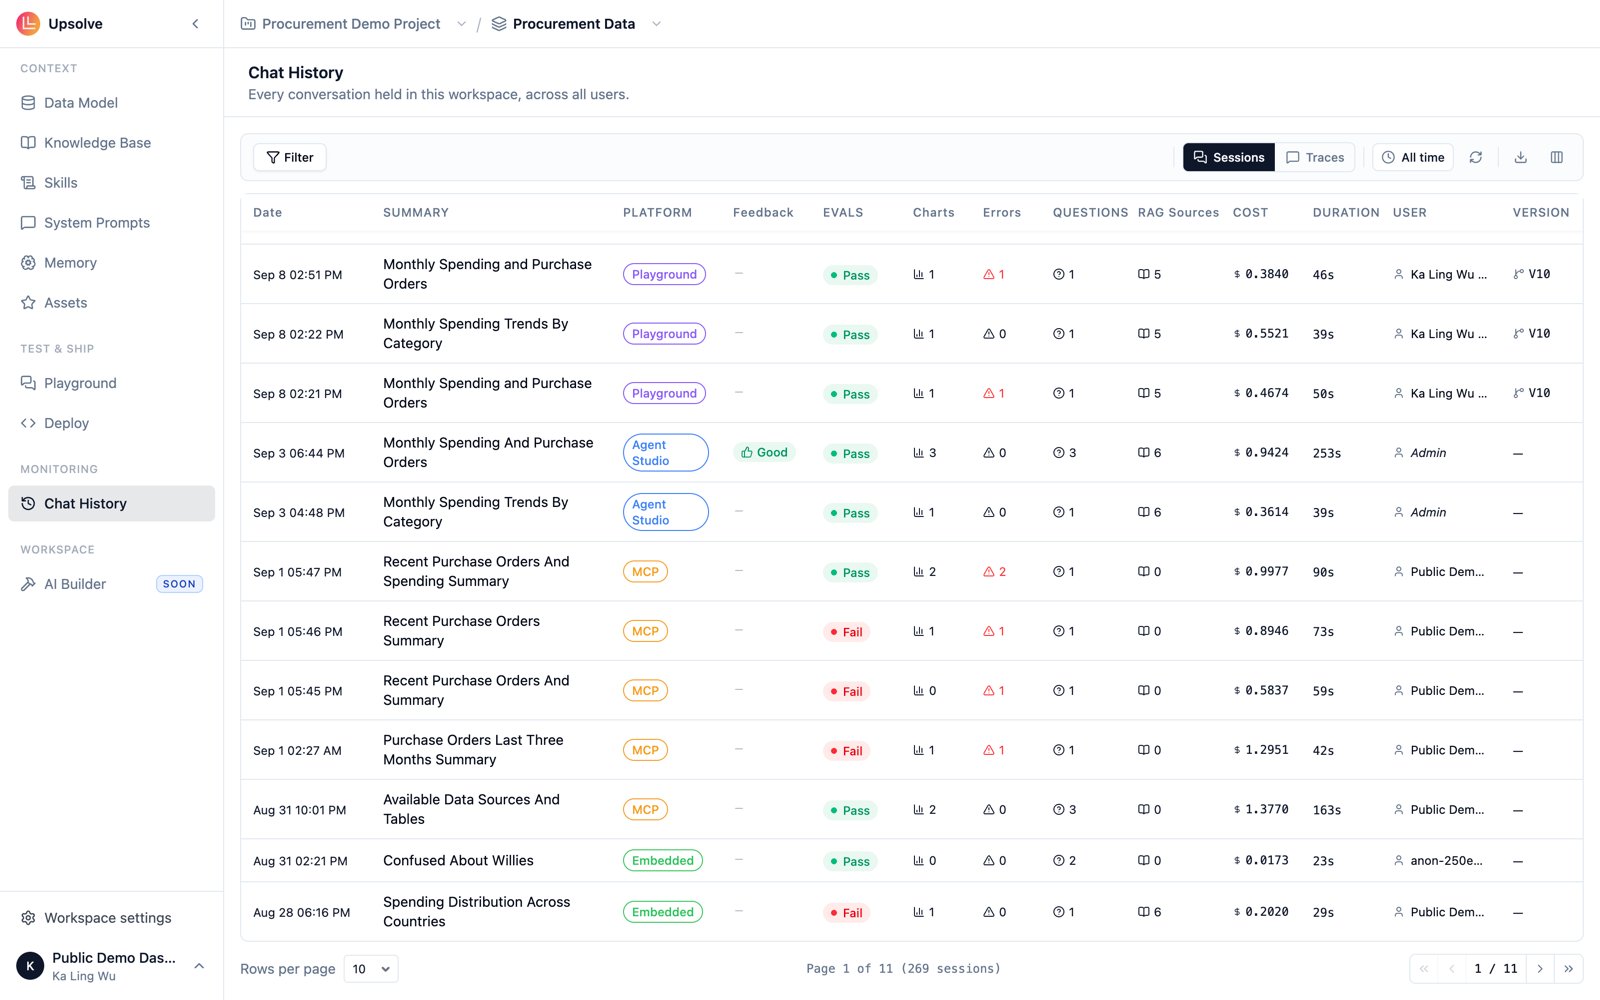
- Sessions — “how is this conversation going?” One row per conversation.
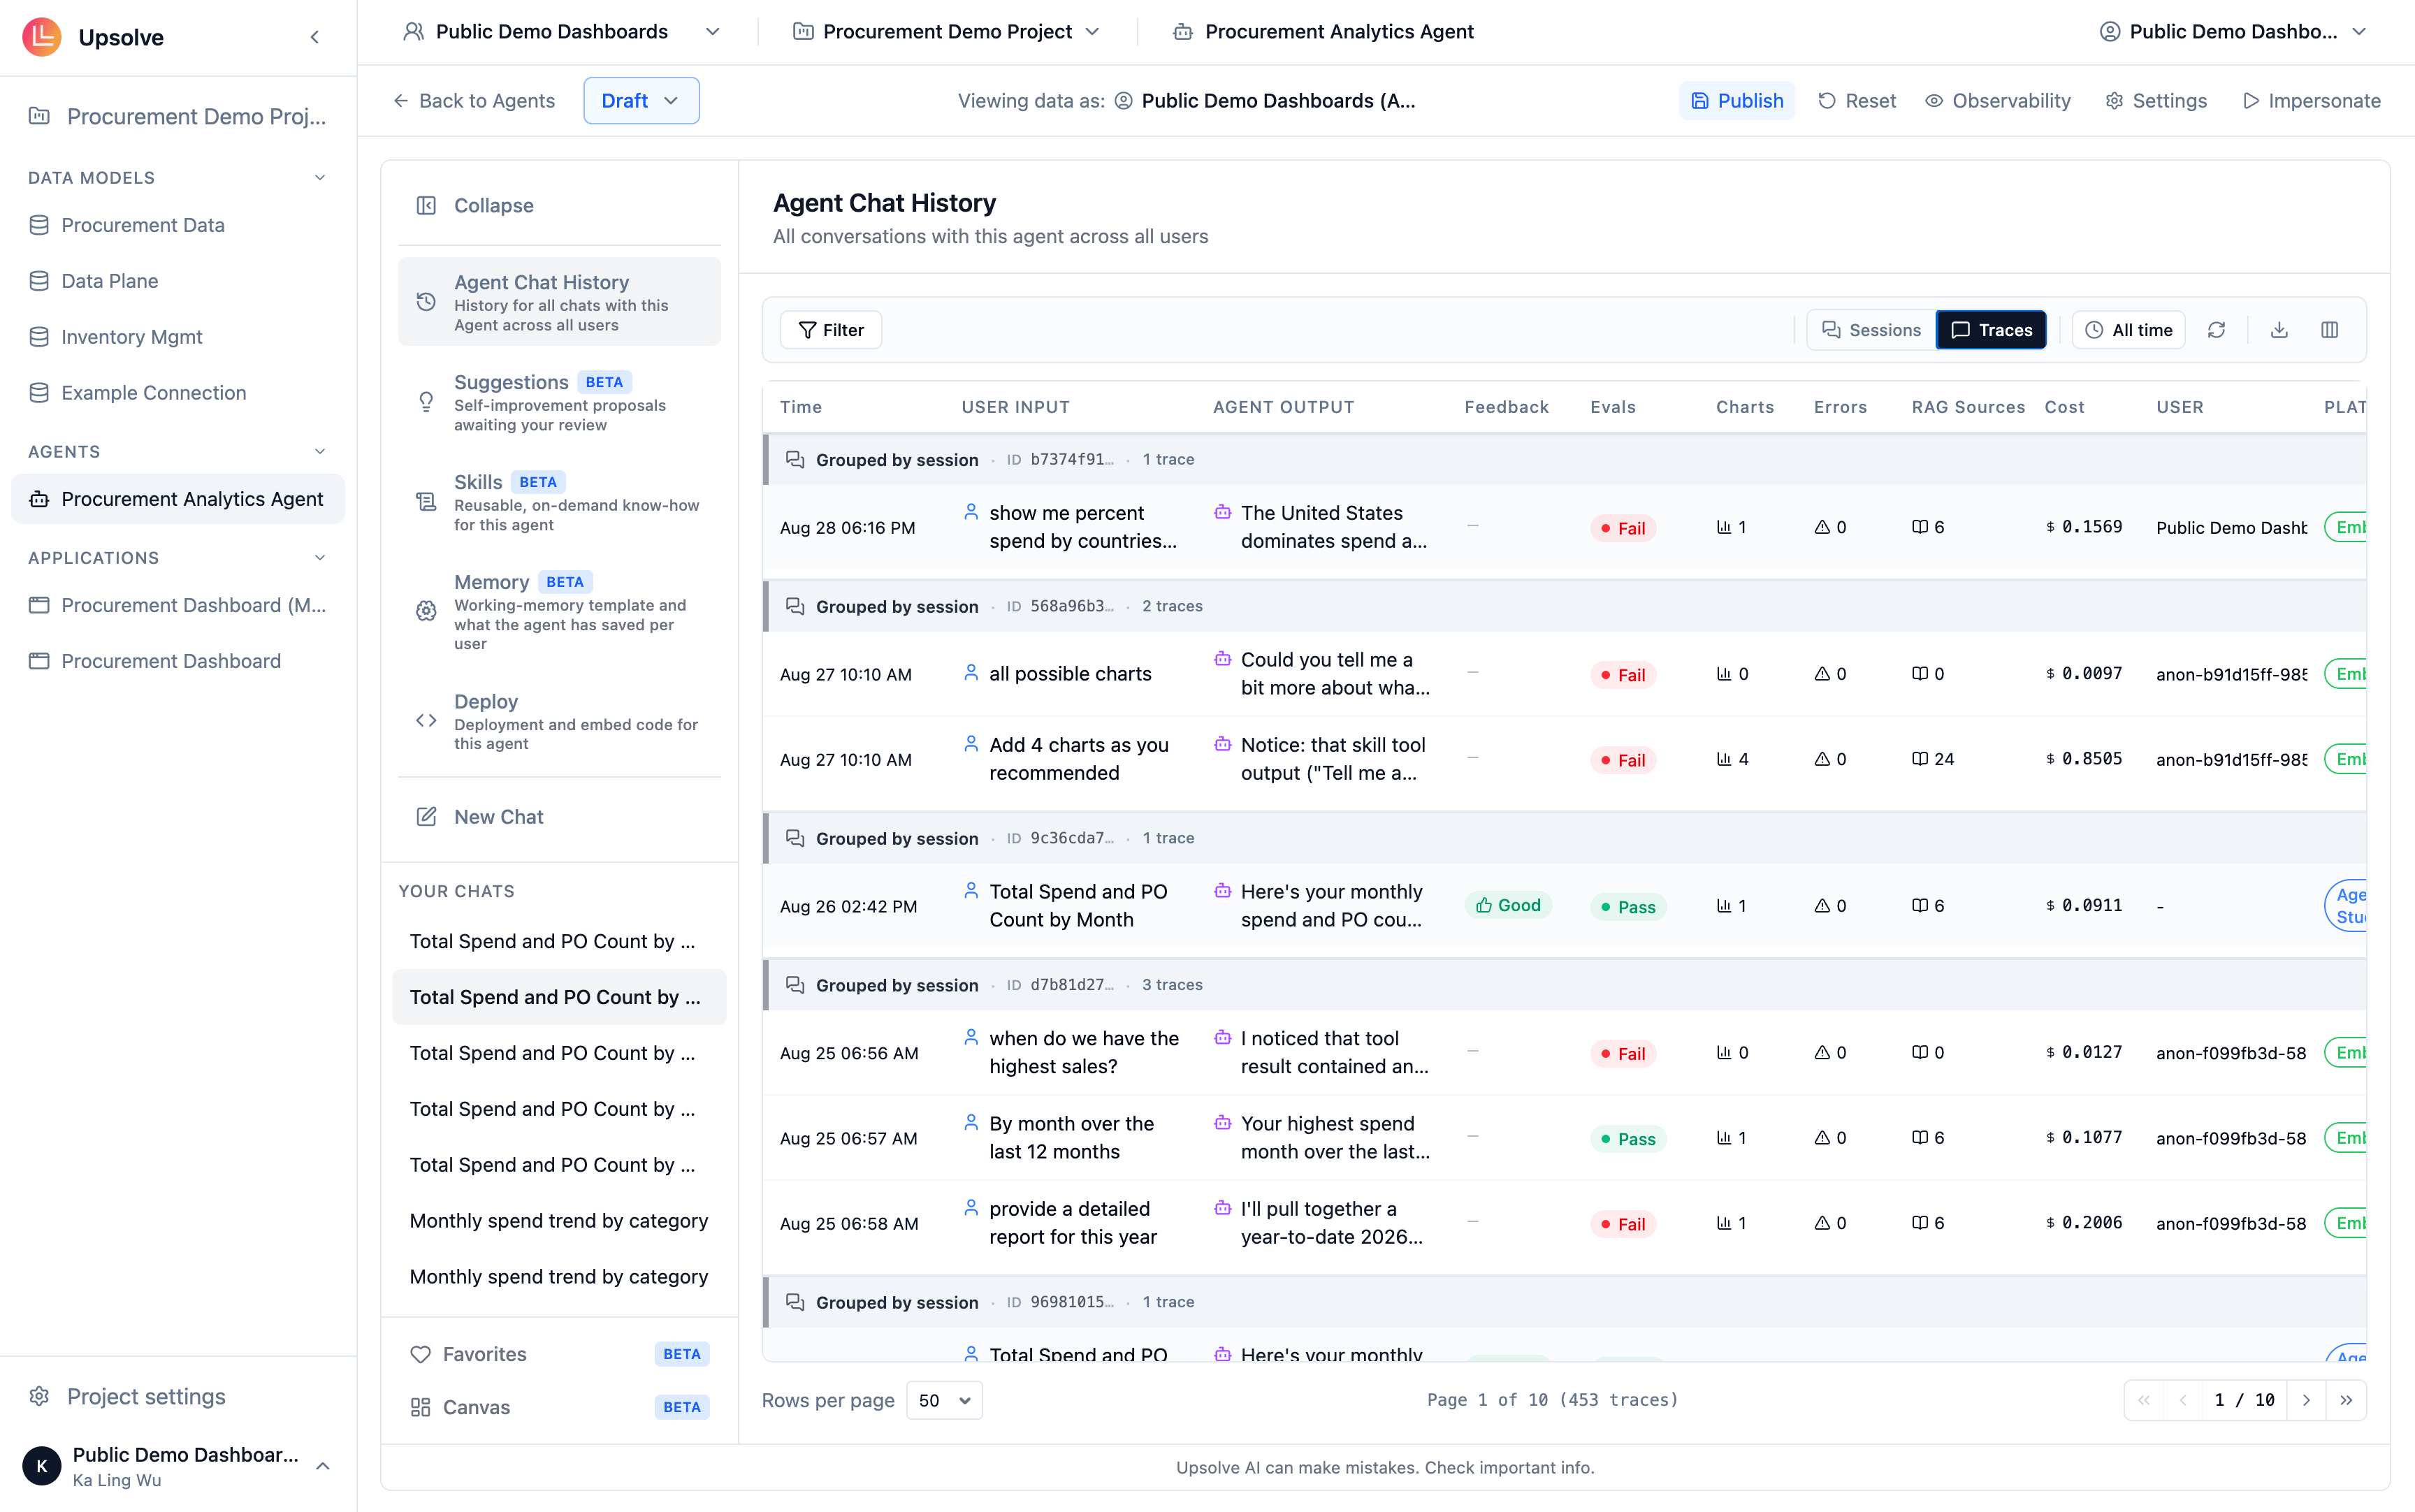
- Traces — “how did this answer turn out?” One row per user question → agent answer exchange.
Sessions view
One row per conversation. Available columns:
Duration, User and Platform are hidden by default. Turn them on from the column picker.
Traces view
One row per exchange, so a five-question conversation produces five rows. This is the grain to work at when you’re triaging quality: an eval failure, a thumbs down or an error belongs to a specific answer, not to the whole session.
User, Platform, Trace ID and # are hidden by default.
Working the table
Filters — the chip bar on the left of the toolbar filters on any visible column: eval status, feedback, platform, user, and numeric ranges for charts, errors, questions, RAG sources and cost. Filters follow column visibility: hiding a column hides its filter but keeps the filter’s value, so toggling the column back on restores it. Time range — narrow to the past 5 minutes, 30 minutes, hour, day, week, month, 3 months or year. Defaults to all time. Columns — the column picker lets you show and hide columns and drag them into the order you want. Columns can also be resized by dragging their edge in the header. Your choices persist per view; Reset to defaults in the picker restores the shipped layout. Reload — re-fetch without leaving the page. Useful when you’re watching a live deployment. Export CSV — exports the current view with the columns you have visible, so the export matches what you’re looking at.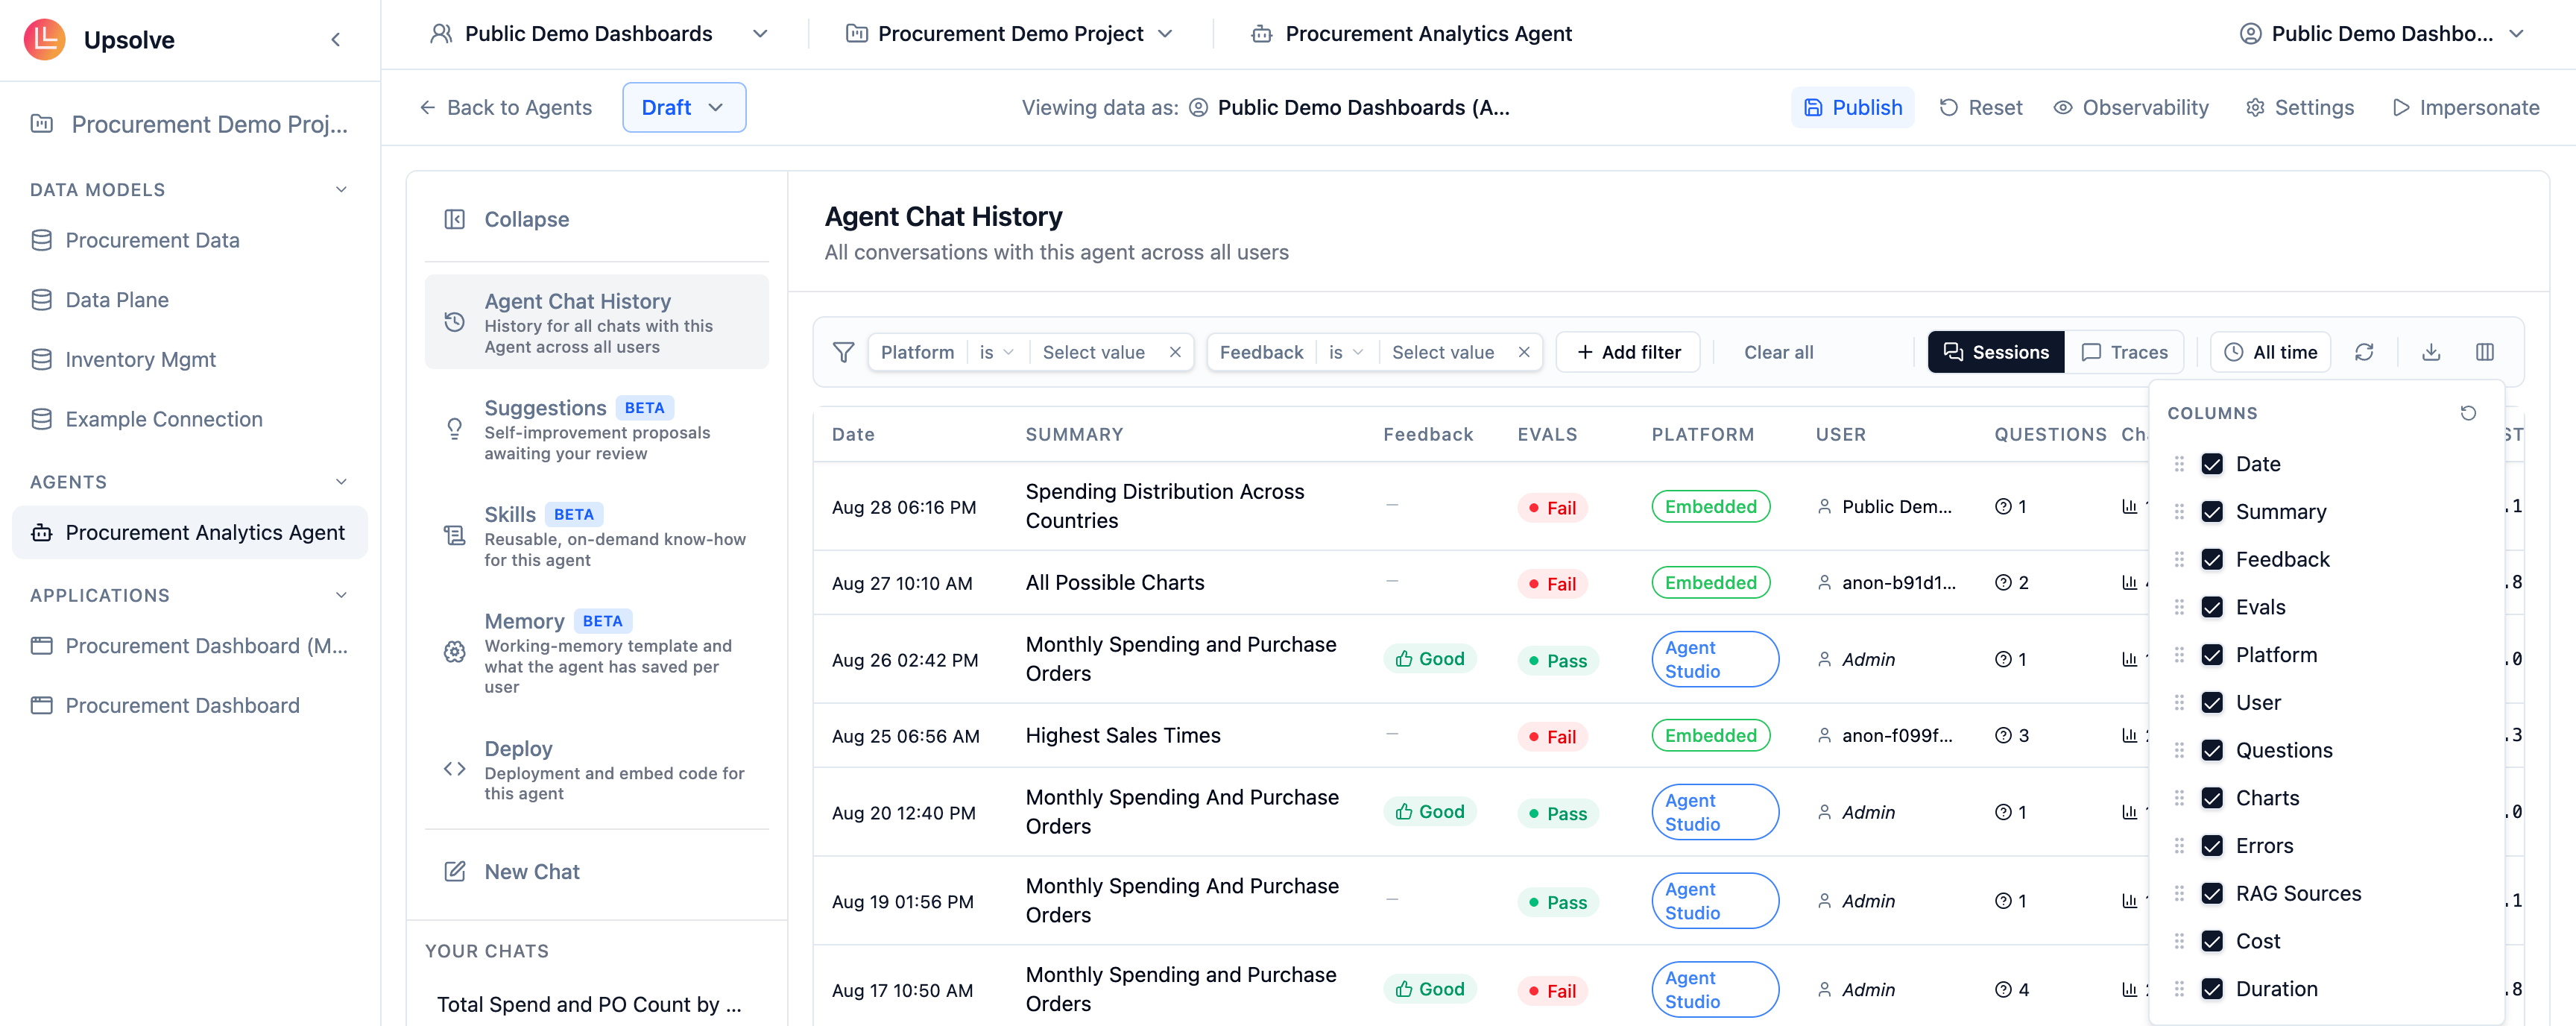
Opening a conversation
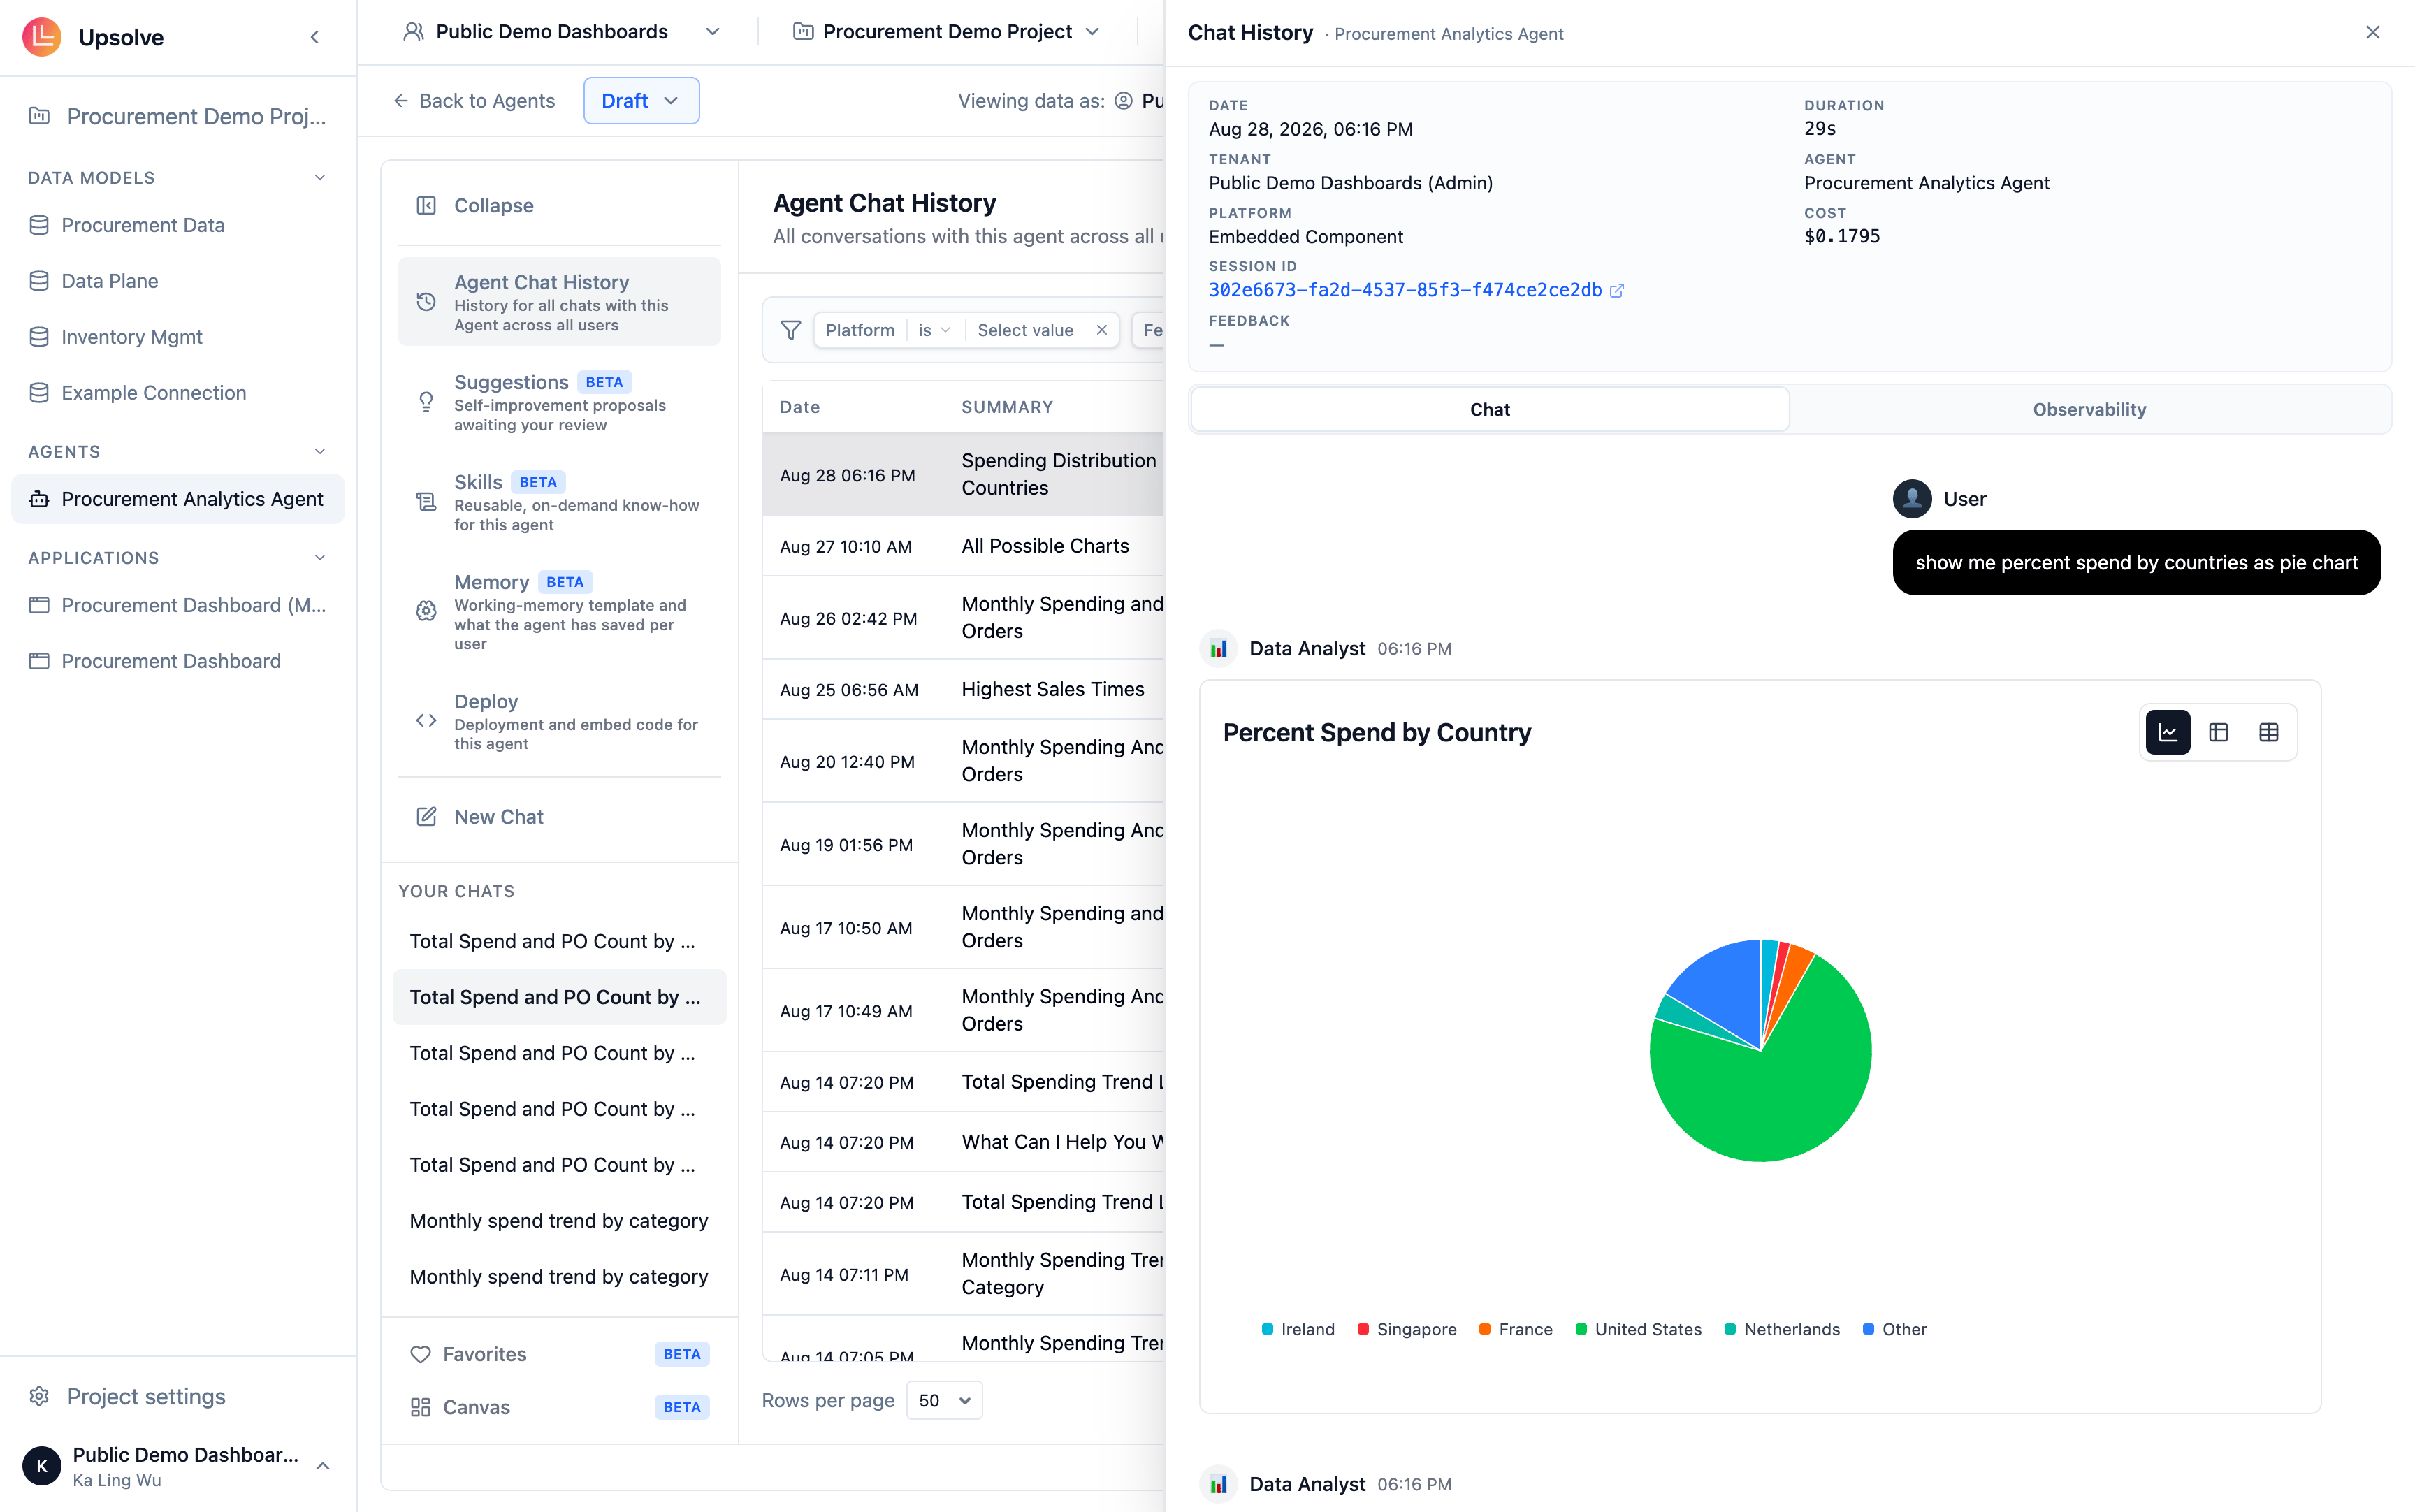
Click any row to open the detail sidebar. The metadata card at the top carries Date, Duration, Tenant, Agent, Platform, Cost, the Session ID, and — when you opened the sidebar from a Traces row — the Trace ID for that exchange. Both identifiers can be copied with one click. If the user left feedback, Feedback and their Comment appear underneath. Below the metadata card are two tabs:- Chat — the conversation exactly as it happened, including the charts the agent rendered.
- Observability — the step-by-step trace of what the agent did. This tab only appears for conversations that actually made tool calls.
Everything here covers deployed end-user chats as well as your own Playground sessions. There is nothing extra to enable — a conversation from an embedded deployment or an MCP client shows up with its Platform set accordingly.
Next steps
Agent Observability
Inspect the step-by-step trace behind any answer, and the evaluations that graded it.
Golden Assets
Add example queries and charts to fix patterns you identify in past conversations.